Universe is Anisotropic on Large Scales, New Study Suggests | Astronomy – Sci-News.com
Space-based X-ray observations of hundreds of galaxy clusters suggest that the Universe may be different depending on which way astronomers look. The study appears in the journal Astronomy & Astrophysics.

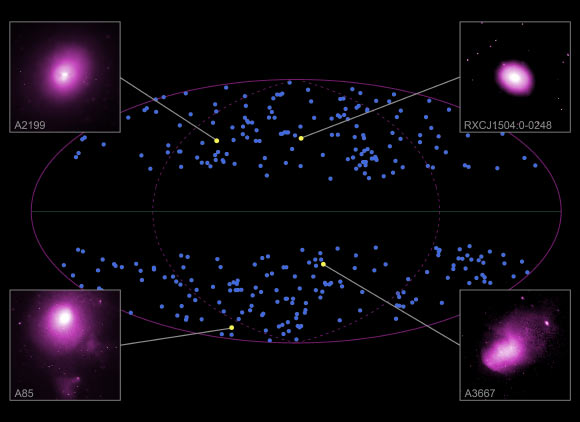
This map of the full sky shows four of the hundreds of galaxy clusters that were analyzed to test whether the Universe is the same in all directions over large scales. Image credit: NASA / CXC / University of Bonn / K. Migkas et al / M. Weiss.
“One of the pillars of cosmology is that the Universe is isotropic, meaning the same in all directions. Our work shows there may be cracks in that pillar,” said Dr. Konstantinos Migkas, an astronomer at the University of Bonn.
Astronomers generally agree that after the Big Bang, the cosmos has continuously expanded.
A commonly analogy is that this expansion is like a baking loaf of raisin bread. As the bread bakes, the raisins (which represent cosmic objects like galaxies and galaxy clusters) all move away from one another as the entire loaf (representing space) expands.
With an even mix the expansion should be uniform in all directions, as it should be with an isotropic Universe. But these new results may not fit that picture.
“Based on our cluster observations we may have found differences in how fast the Universe is expanding depending on which way we looked,” said Dr. Gerrit Schellenberger, an astronomer in the Harvard & Smithsonian Center for Astrophysics.
“This would contradict one of the most basic underlying assumptions we use in cosmology today.”
Astronomers have previously conducted many tests of whether the Universe is the same in all directions. These included using optical observations of exploded stars and infrared studies of galaxies.
Some of these previous efforts have produced possible evidence that the Universe is not isotropic, and some have not.
The latest test uses a powerful, novel and independent technique.
It capitalizes on the relationship between the temperature of the hot gas pervading a galaxy cluster and the amount of X-rays it produces, known as the cluster’s X-ray luminosity. The higher the temperature of the gas in a cluster, the higher the X-ray luminosity is.
Once the temperature of the cluster gas is measured, the X-ray luminosity can be estimated. This method is independent of cosmological quantities, including the expansion speed of the Universe.
Once they estimated the X-ray luminosities of their clusters using this technique, Dr. Migkas, Dr. Schellenberger and colleagues then calculated luminosities using a different method that does depend on cosmological quantities, including the Universe’s expansion speed.
The astronomers used a sample of 313 galaxy clusters for their analysis, containing 237 clusters observed by NASA’s Chandra X-ray Observatory with a total of 191 days of exposure, and 76 observed by ESA’s XMM-Newton spacecraft, with a total of 35 days of exposure.
They also combined their sample of galaxy clusters with two other large X-ray samples, using data from XMM-Newton and the Japan-US Advanced Satellite for Cosmology and Astrophysics (ASCA), giving a total of 842 different galaxy clusters.
The results gave the researchers apparent expansion speeds across the whole sky, revealing that the Universe appears to be moving away from us faster in some directions than others.
They also compared their findings with studies from other groups that have found indications of a lack of isotropy using different techniques. They found good agreement on the direction of the lowest expansion rate.
The scientists came up with two possible explanations for their results that involve cosmology.
One of these explanations is that large groups of galaxy clusters might be moving together, but not because of cosmic expansion. For example, it is possible some nearby clusters are being pulled in the same direction by the gravity of groups of other galaxy clusters. If the motion is rapid enough it could lead to errors in estimating the luminosities of the clusters.
These sorts of correlated motions would give the appearance of different expansion rates in different directions.
Astronomers have seen similar effects with relatively nearby galaxies, at distances typically less than 850 million light years, where mutual gravitational attraction is known to control the motion of objects.
However, the authors expected the expansion of the Universe to dominate the motion of clusters across larger distances, up to the 5 billion light years probed in this new study.
A second possible explanation is that the Universe is not actually the same in all directions.
One intriguing reason could be that dark energy — the mysterious force that seems to be driving acceleration of the expansion of the Universe — is itself not uniform. In other words, the X-rays may reveal that dark energy is stronger in some parts of the Universe than others, causing different expansion rates.
“This would be like if the yeast in the bread isn’t evenly mixed, causing it to expand faster in some places than in others,” said Dr. Thomas Reiprich, an astronomer at the University of Bonn.
“It would be remarkable if dark energy were found to have different strengths in different parts of the Universe. However, much more evidence would be needed to rule out other explanations and make a convincing case.”
Either of these two cosmological explanations would have significant consequences. Many studies in cosmology, including X-ray studies of galaxy clusters, assume that the Universe is isotropic and that correlated motions are negligible compared to the cosmic expansion at the distances probed here.
_____
K. Migkas et al. 2020. Probing cosmic isotropy with a new X-ray galaxy cluster sample through the LX-T scaling relation. A&A 636, A15; doi: 10.1051/0004-6361/201936602
This article is based on text provided by the National Aeronautics and Space Administration.


