Why Has DXC Technology Tanked 50% This Year? – Forbes

BRAZIL – 2019/07/08: In this photo illustration a DXC Technology logo seen displayed on a … [+] smartphone. (Photo Illustration by Rafael Henrique/SOPA Images/LightRocket via Getty Images)
SOPA Images/LightRocket via Getty Images
DXC Technology (NYSE: DXC) is an end-to-end IT services company that was formed via the merger of the Computer Sciences Corporation and a spin-off of Hewlett Packard Enterprise’s Enterprise Service business. DXC stock has declined this year, falling by roughly 50% year-to-date. Overall, the merger has been a mixed bag, with revenues posting steady declines and the company unable to cut costs at the same pace, leading to weaker investor interest. Much of the decline in the stock price came in August after the company slashed its full-year earnings and revenue guidance citing currency headwinds, some pressure on its legacy businesses, and delays relating to some deals. Below, we take a look at how the company has performed over the last few years and its outlook over the next two fiscal years.
View our interactive dashboard analysis Why Has DXC Technology Stock Declined 50% This Year?
How does DXC Technology’s Revenue Growth in 2019 compare with that in prior periods and what’s the forecast?
Trefis
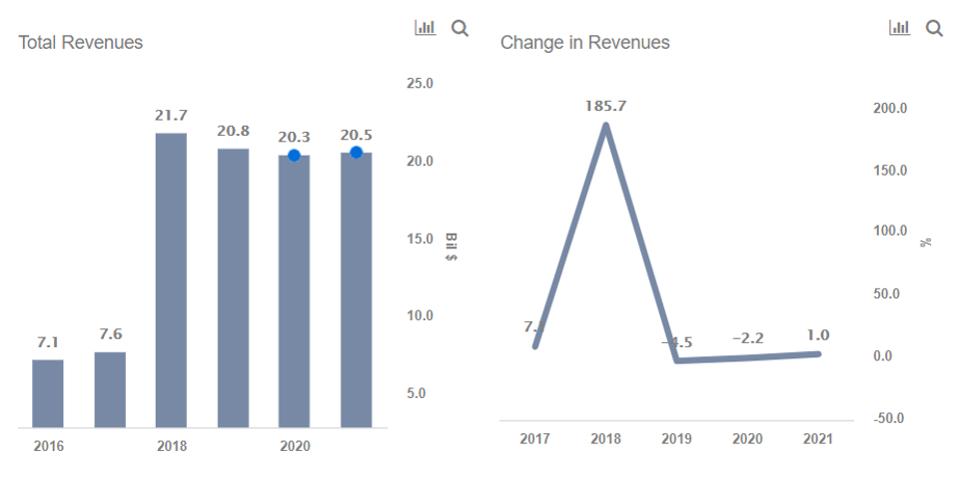
Total Revenues for DXC Technology declined from $21.7 billion in FY’18 to $20.8 billion in FY’19. (FY ends March 31)
This compares with Total Revenues growth of:
- 7.05% in FY’17 compared to FY’16
- 185% in FY’18 compared to FY’17, due to the merger.
We expect Total Revenues to decline by 2% this fiscal year.
How does DXC Technology’s Total Expense in 2019 compare with that in prior periods and what’s the forecast?
Total Expense for DXC Technology stood at $19.2 billion in FY’19, marking a decline of 6%.
This compares with Total Expense growth of:
- 163% in FY’18 compared to FY’17
We expect Total Expense growth to be -0.2% in FY’20.
How does DXC Technology’s EBT in 2019 compare with that in prior periods and what’s the forecast?
EBT for DXC Technology increased by 16% from $1.3 Bil in 2018 to $1.5 Bil in 2019.
We expect EBT to decline 27% this year to $1.1 billion.
How do DXC Technology’s Net Income and EPS in 2019 compare with that in prior periods and what’s the forecast?
For more details on DXC Technology’s Net Income and EPS, view our interactive dashboard analysis on the company.
What’s behind Trefis? See How It’s Powering New Collaboration and What-Ifs For CFOs and Finance Teams| Product, R&D, and Marketing Teams More Trefis Data Like our charts? Explore example interactive dashboards and create your own


